Beyond the Numbers: Getting the Most Out of VSPECT™ Diagnostics
by Colin Archambault | Updated: 08/19/2025 | Comments: 0
Blog Topics
Area / Application


Product Category


Corporate / News
Search the Blog
Subscribe to the Blog
Get an email when a new article is posted. Choose the topics that interest you most.
Suggest an Article
Is there a topic you would like to learn more about? Let us know.
If you're using VSPECT™ technology for your vibrating wire measurements, how do you validate each measurement's quality?
VSPECT technology is designed to do more than just read a number—it helps you understand the quality behind every measurement. By going beyond the natural frequency of a vibrating wire sensor, VSPECT generates diagnostic values that help confirm whether your data are solid, reliable, and ready to be used.
Every vibrating wire interface Campbell Scientific sells is equipped with VSPECT technology. What's more, the Vibrating Wire Analyzer (VWAnalyzer) is even capable of generating a clean, detailed report for each measurement. But the real questions are the following: Are you getting everything you can from the technology? What do all those diagnostics and settings really mean? And how do you know if a sensor is deployment-ready?
In this blog article, we’ll walk through VSPECT’s diagnostic parameters and settings, breaking down what they are, what they do, and how you can use them to get the most reliable data possible.
Start with Smart Settings
Frequency Sweep
By default, VSPECT covers a frequency range of 300 to 6,500 Hz, which encompasses the operating range of most modern vibrating wire sensors. This works well for general use, but you can improve measurement quality by tuning the sweep to match your sensor’s expected output. Here’s why that matters:
- Targeted excitation – Narrowing the range focuses energy only where it matters, improving signal strength and reducing noise.
- Higher confidence – Narrowing the range blocks out irrelevant frequencies, so you know the signal you’re seeing is from your sensor and not something else.
But what does “sweep” mean in this context? In VSPECT, a sweep means the wire is gently excited across a frequency range rather than sharply plucked. Sweeping the excitation frequency in the correct range ensures the sensor is excited near its resonant frequency, resulting in accurate and repeatable readings.
Excitation Settings
VSPECT-enabled devices are designed with flexibility in mind. They offer multiple excitation levels to suit different installation conditions.
By default, the excitation is set to 5 volts. This works well for most applications and delivers dependable, high-quality readings. But in certain cases, bumping the excitation up to 12 volts can make a noticeable difference. Why? Because a higher excitation level sends more energy to the sensor, which helps produce a stronger signal.
A stronger signal is especially useful when you're dealing with very long cable runs—think several hundred meters or more. In these situations, the extra energy helps overcome signal loss caused by cable resistance and attenuation, ensuring your data stay accurate and reliable.
When Higher Excitation Makes Sense
Boosting excitation can be especially useful in a couple of situations:
- Noisy environments – Increasing the excitation strength enhances the returned signal amplitude, improving the signal-to-noise ratio (SNR) and helping the signal rise above background electrical noise.
- Weak sensor response – If a sensor isn’t responding well, applying a stronger excitation can boost its signal response, producing a more pronounced return signal and increasing confidence in the measurement.
When Lower Excitation Makes Sense
On the flip side, lower excitation is ideal for high-frequency monitoring. Newer VSPECT-enabled devices have enhanced processing power and can now read sensors as frequently as once per second (1 Hz). But in these cases, you don’t want the sensor to still be vibrating from the last excitation when the next reading begins.
To prevent this overlap, newer devices can be configured to a lower excitation level—just 2 volts. This ensures the sensor has enough time to settle between readings, avoiding interference from leftover vibrations and delivering more accurate results.
VSPECT-enabled devices offer three excitation levels to help match your installation needs:
| Excitation | When to Use |
|---|---|
| 5 V (default) | Works well for most sensors and setups |
| 12 V | Best for long cable runs, noisy environments, or weak sensor signals |
| 2 V | Ideal for high-frequency readings; prevents the sensor from vibrating into the next reading cycle |
Does higher excitation shorten sensor life? Here’s what the research says.
Good news: there’s no credible evidence that using higher excitation levels (within the recommended range) shortens the lifespan of vibrating wire sensors.
In fact, there are no published studies showing that stronger excitation causes premature wear, fatigue, or failure of these sensors. Quite the opposite—a long-term study by the Norwegian Geotechnical Institute (NGI) looked at the effects of continuous excitation for more than 25 years: https://www.tib.eu/en/search/id/BLCP:CN071467090/A-case-study-of-vibrating-wire-sensors-that-have/. The results? No measurable fatigue or damage to the sensor wires, even after decades of use.
So, you can feel confident using higher excitation levels when needed, knowing your sensors are built to handle it.
Understanding the Diagnostics
While the measured frequency is the key result, the additional diagnostics play an important role in evaluating the quality of that signal. They help confirm that the frequency reported is not only accurate, but also trustworthy.
Here are the additional diagnostics in order of importance for qualifying the measurement:
#1 – SNR: The MVP of Diagnostics
This is the most important diagnostic to watch. It shows the ratio between the sensor’s main signal and the strongest nearby noise, essentially telling you how clearly the signal stands out from any interference.
- SNR > 3 → Good signal (generally)
- SNR > 10, 100, or even 1,000 → Excellent signal in a clean environment
- SNR ≈ 1–3 → Questionable; verify with a VWAnalyzer
Boosting the SNR can often be done by narrowing the frequency sweep and/or increasing excitation.
#2 – Frequency Amplitude
This value shows the electrical strength of the vibrating wire’s response—essentially, the signal strength.
- > 0.1 mV → Generally considered to be an acceptable response
- < 0.01 mV → VSPECT ignores by default
Similar to improving the SNR, adjusting the sweep frequency to a sensor-specific excitation and/or increasing the excitation amplitude can increase the response amplitude from the sensor.
#3 – Noise Frequency
The noise frequency refers to the second strongest signal within the defined sweep range. While it’s not a primary diagnostic, knowing the noise frequency can be helpful when you're trying to identify potential sources of electrical interference in the area.
- Noise frequency can change from one reading to the next and usually isn’t a problem—unless you're troubleshooting a low SNR.
- For a clearer view of what’s going on, the frequency spectrum graph on a VWAnalyzer is a great tool for spotting and visualizing noise sources.
#4 – Decay Ratio
This tells you how quickly the sensor’s signal fades after it's been excited—in other words, how fast the wire returns to its resting state.
- While it’s not typically essential for confirming a good reading, keeping an eye on the decay ratio over time can offer insights into the sensor’s long-term health.
- It’s also normal for decay ratios to vary, even between identical sensors. A faster or slower decay doesn’t mean something’s wrong; it’s just part of the natural variation.
Extra Measurements: Temperature
Many vibrating wire sensors come with built-in thermistors, which are especially useful when temperature correction is needed, such as with strain gauge measurements.
The way temperature is measured depends on the type of thermistor used. Most manufacturers use a 3 kohm thermistor, meaning it has a resistance of 3 kohm at 25°C (77°F).
If the right thermistor model is selected—or if the correct conversion factors are entered—some devices can automatically convert that resistance into a temperature reading in either Celsius or Fahrenheit.
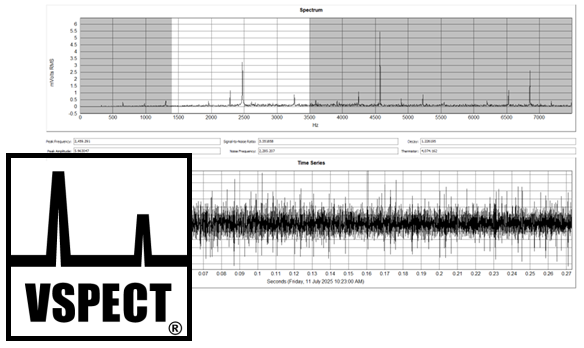
Visualizing the Data: Graphs that Speak Volumes
VSPECT technology allows a user to create a graphical plot to easily see both the time and frequency domains, giving you a clearer picture of how the sensor is responding. You can view these plots in the Device Configuration Utility (DevConfig) when using the CR6 Automated Monitoring Platform or the AVW200 2-Channel Vibrating Wire Analyzer Module. Alternatively, you can see these plots instantly on-screen after taking a measurement with a VWAnalyzer.
- Time series plot – Displays amplitude (in mV) over time (s) for the first 300 milliseconds after excitation. Use this to spot waveform irregularities, check signal consistency, and compare performance across measurements.
- Frequency domain plot – This graph shows the results of applying a Fast Fourier Transform (FFT) to the raw signal, plotting amplitude against frequency as a scatter plot. With this graph, you get a quick visual of the main signal frequency, as well as any surrounding noise or competing signals.
The white area of the graph represents the declared sweep frequency—the range from which valid sensor responses are accepted. Everything outside that range is ignored.
In a clean environment, such as what you see in Graph 1 below, the sensor produces a strong, clear peak. In contrast, Graph 2 further below shows a noisier signal (the same one from the previous time series graph), where the dominant frequency is still detected thanks to VSPECT. But the extra noise and harmonics are now easier to see, helping you identify potential interference sources and make informed decisions to improve measurement reliability.
The two images below show readings from the same spot-weldable vibrating wire strain gauge, each captured under different noise conditions. These plots—viewed in the DevConfig VW Diagnostics tab—were generated from diagnostic files created by the CR6.
Example 1
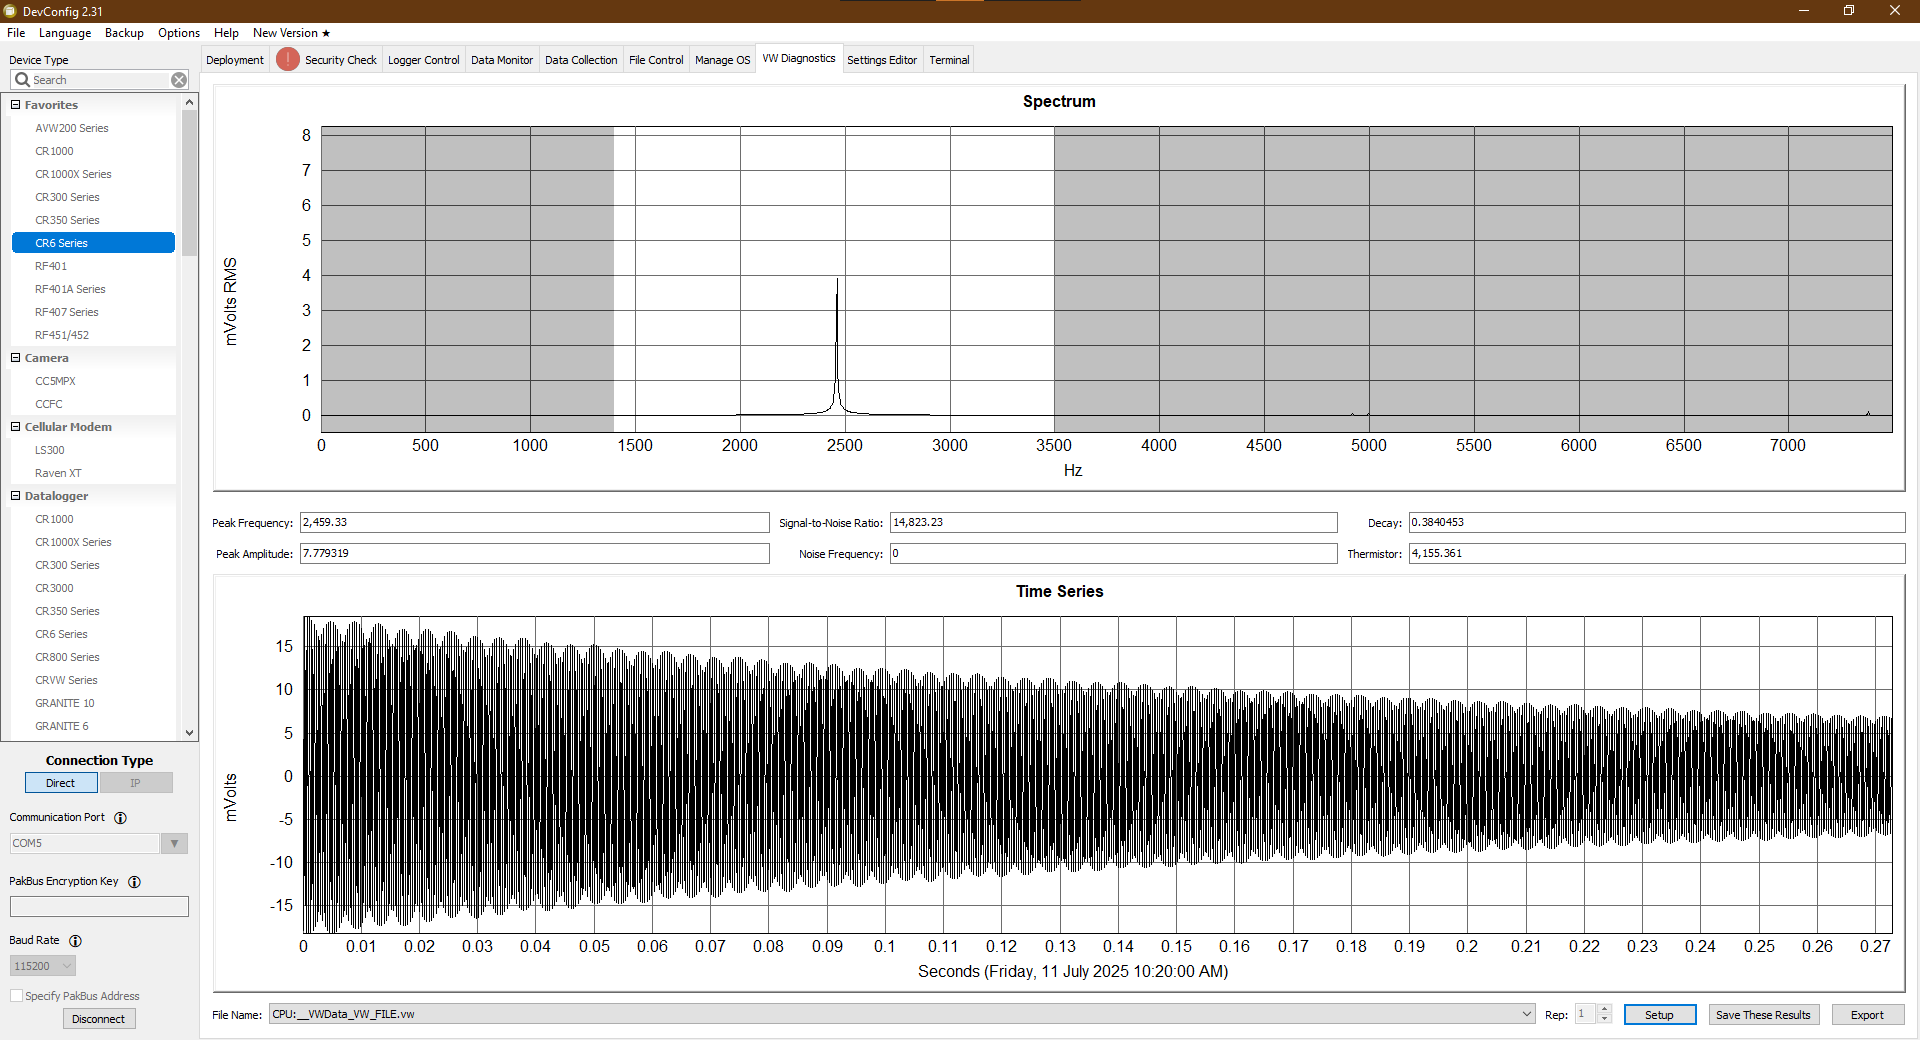
Graph 1: Clean Signal, High Confidence
Click the graph for a larger image.
In this first example, the sensor is measured in an ideal environment with virtually no noise in the sweep range. A small blip appears around 5,000 Hz, but VSPECT intelligently filters it out. The true signal stands out clearly at 2,460 Hz with a strong amplitude of 7.8 mV and no interference, leading to an excellent SNR. The time domain plot shows a smooth, repeating waveform and a gentle decay—indicators of a high-quality measurement.
Summary
- Noise: Minimal
- Signal: 2,460 Hz, 7.8 mV amplitude
- SNR: Extremely high
- Insight: Both time and frequency plots confirm a clean, accurate signal. Confidence level = very high
Example 2
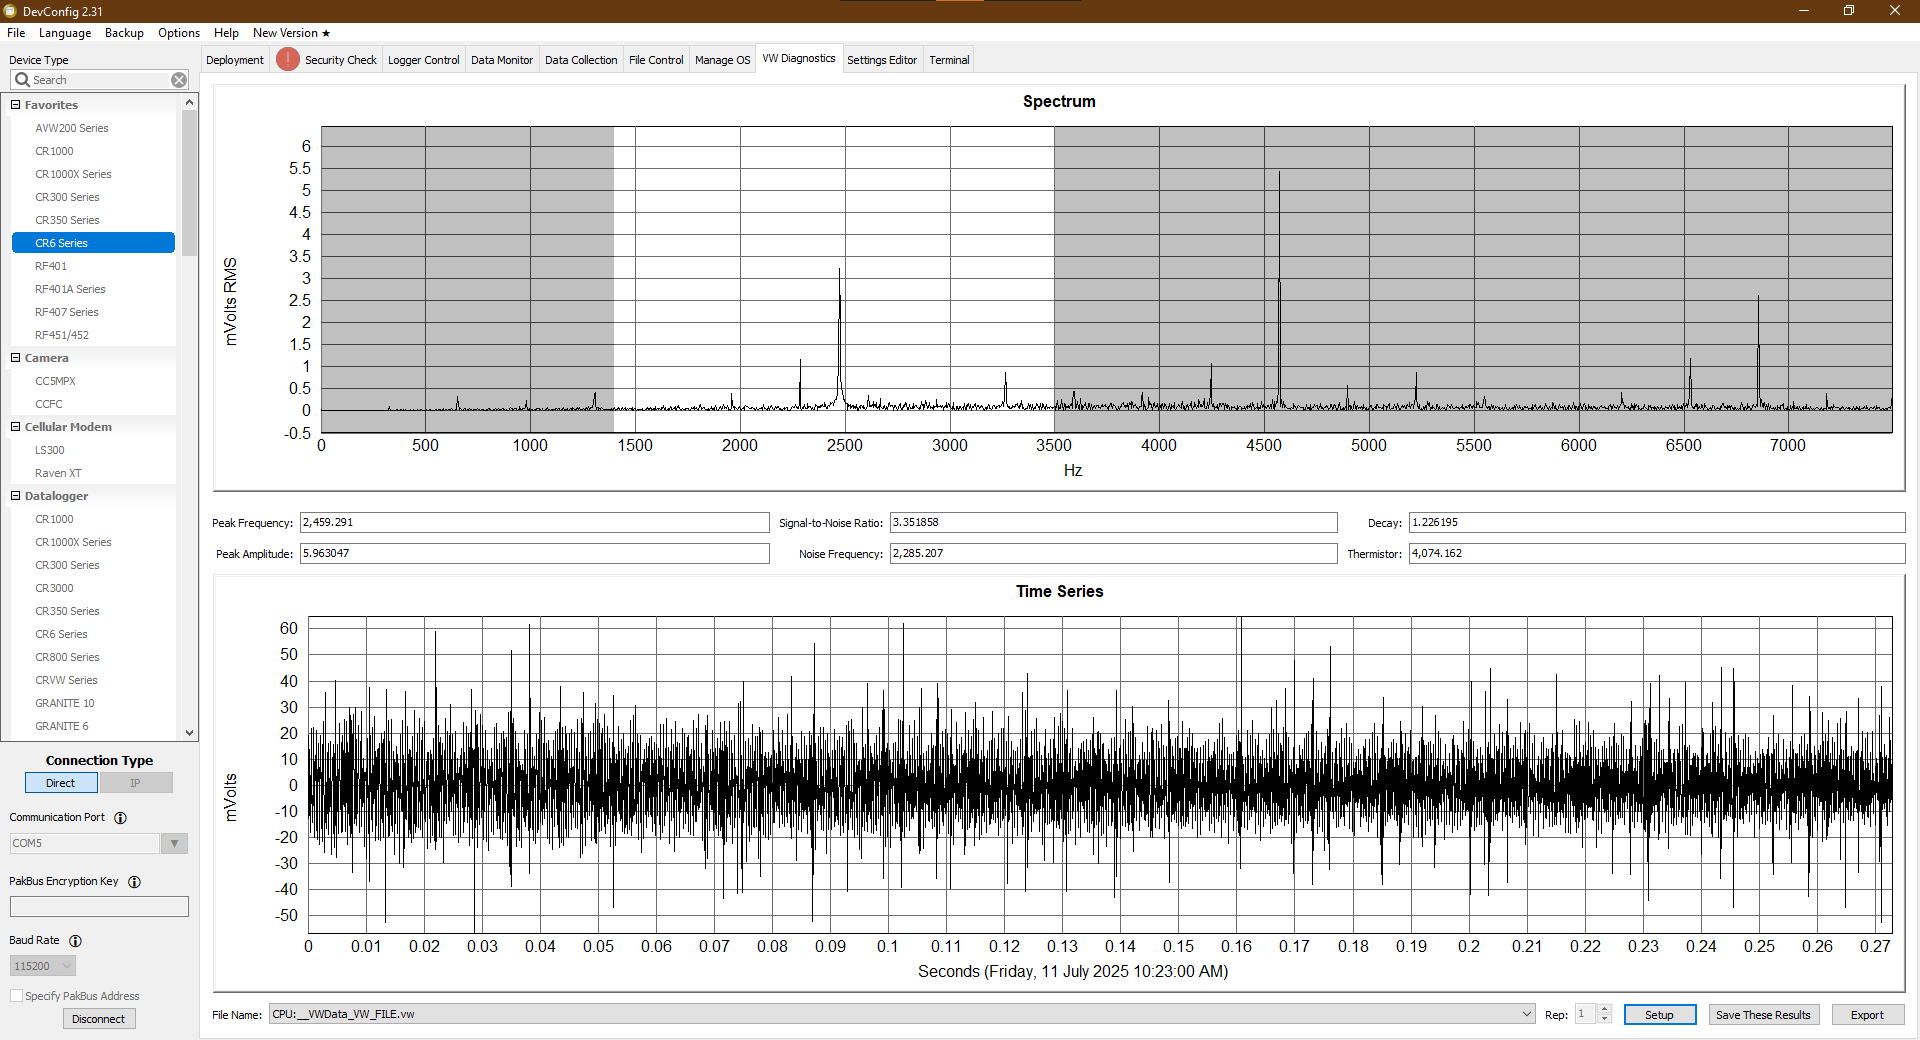
Graph 2: Noisy Signal, Still a Good Reading
Click the graph for a larger image.
In this second example, the sensor is operating in a much noisier environment. Harmonics, or echoes of one of the signal's many components, can appear within the sweep range due to mechanical resonance or signal interference. Their presence can obscure the primary signal in the time-domain view, complicating visual identification of the true sensor response. However, by narrowing the sweep range to match the sensor’s characteristics, VSPECT still correctly identifies the natural frequency at 2,460 Hz, even if a stronger signal is present at 4,500 Hz. While the identified signal amplitude is slightly lower, the SNR sits comfortably above 3, and we can have full confidence in the results. This is further demonstrated by how closely the measurement matches the results from the quieter environment.
Summary
- Noise: Strong at 4,500 Hz, but successfully filtered out
- Signal: Correct frequency still identified; amplitude reduced but stable
- SNR: Just above 3; still acceptable
- Insight: Despite noise, the frequency domain plot confirms a reliable measurement.
Final Thoughts
VSPECT gives you more than just a number—it gives you confidence. The diagnostic tools help ensure your sensors are working correctly, even in challenging environments. Whether you’re installing a new system or bringing old sensors back into service, VSPECT is a powerful tool for getting clean, reliable data from vibrating wire sensors.
Do you have questions about optimizing your setup? Please reach out to our support and implementation team or sales team, as we are happy to help answer any questions you have!
Credits: Brent Randall of Campbell Scientific, Inc. contributed to this article.


About the Author
 Colin Archambault is a Senior Application Specialist in the Infrastructure Group at Campbell Scientific, operating from Sydney, Australia. He joined Campbell Scientific in 2022 after 10 years spent working as a geotechnical instrumentation expert for well-established monitoring consultants. Colin has a bachelor's degree in Geological Engineering from Ecole Polytechnique de Montreal, Canada. He divides his days between designing custom data logger systems for clients, working on complex data logger programs, and supporting customers during field deployment.
Comments
Please log in or register to comment.