Relative Humidity: To Average, or Not to Average?
by Dirk Baker | Updated: 01/30/2020 | Comments: 2
Blog Topics
Area / Application


Product Category


Corporate / News
Search the Blog
Subscribe to the Blog
Get an email when a new article is posted. Choose the topics that interest you most.
Suggest an Article
Is there a topic you would like to learn more about? Let us know.

Have you ever been told not to average relative humidity (RH)? Have you ever created a data logger program with Short Cut and noticed that it does not allow you to average RH when you generate your data table? Do you know why?
In this blog article, I’ll briefly describe the reasons why you shouldn’t average RH, and share some data illustrating the implications.
Background
Let’s start with a definition of relative humidity. Most texts and online resources define relative humidity as follows:
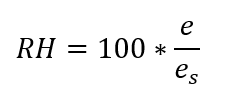
where e is the observed/measured vapor pressure and es is the saturation vapor pressure. However, vapor pressure may not be the most intuitive concept. Simply put, relative humidity is the observed amount of water in a given volume of air divided by the maximum amount of water that the air could hold without producing precipitation. This saturation point is highly temperature dependent.
Lowe (1976)1 described the following model for calculating saturation vapor pressure:

where T is temperature in Celsius and the values for the fitted coefficients (α) are as follows:
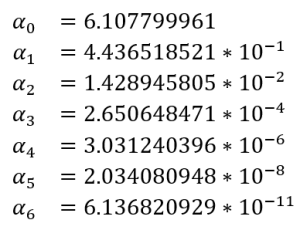
While there are other methods to obtain saturation vapor pressure that we could consider, the Lowe model is used in Campbell Scientific data loggers, so I’ll limit my discussion to that method for the purposes of this article.
There are two reasons why a simple average of RH over a given data interval is generally not the best practice. First, RH is a calculated value. Mathematicians and statisticians advise us that it is better to use the original data in operations such as averages, then calculate the desired value. In addition, RH is, by definition, limited to values between zero and 100. Therefore, values near those upper and lower bounds cannot vary as much as those toward the middle, which violates statistical assumptions.
The second and more important reason not to use simple averaging for RH is that the value can change rapidly with temperature, especially at higher temperatures. Figure 1 shows the relationship between temperature and saturation vapor pressure based on the Lowe model.
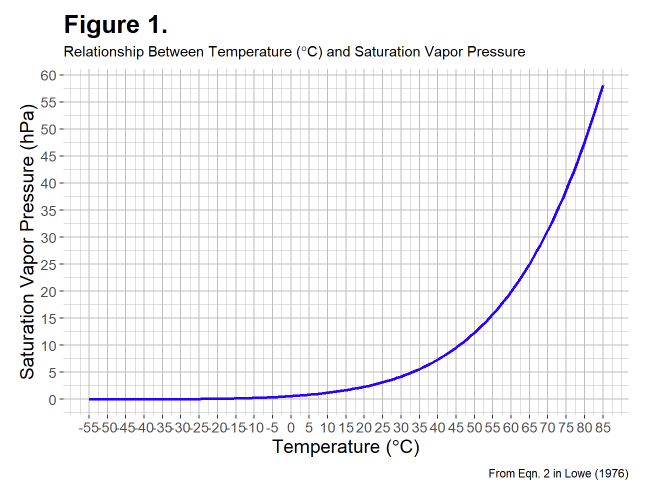
Of particular note is that saturation vapor pressure changes more rapidly at higher temperatures. Therefore, simple arithmetic averages of RH at higher temperatures are likely to have greater error. Averaging over longer intervals is also likely to result in greater error.
How to Correctly Average RH
The preferred method to obtain an average RH over a given interval is to average the vapor pressure and saturation vapor pressures, then calculate RH from those averages. Here's a link to download a CRBasic program that does just that. During each scan, this program calculates vapor pressure and saturation vapor pressure, then stores the vapor pressure averages in a temporary, hidden table. Those values are then used to calculate RH, and all the values are stored in the main hourly table.
To illustrate the difference between the two methods of calculating an average for RH (simple arithmetic versus from averaged vapor pressures), I collected data from a weather station near the Campbell Scientific facilities in Logan, Utah, for approximately 17 months. A program similar to the one described above was used, and data were stored at four intervals:
- 30 minutes
- 1 hour
- 3 hours
- 24 hours
Figure 2 shows the results:
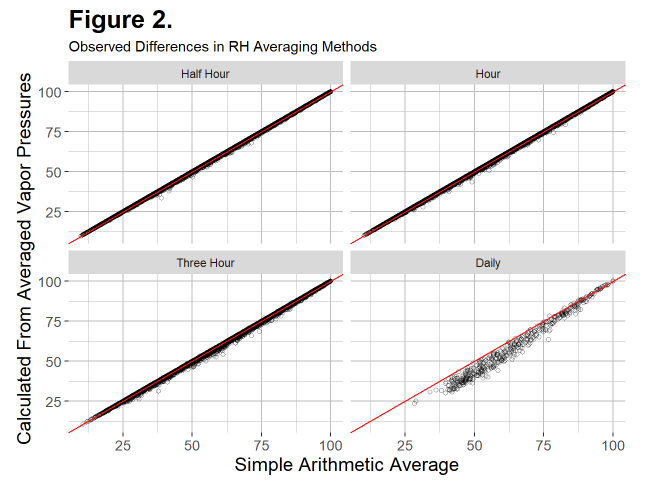
If the two methods were the same, we would expect all the datapoints to line up on the red 1:1 lines. For the half-hour and hourly intervals, there is good agreement. However, for longer intervals, error increases substantially. Interestingly, at least in these data, error due to simple averaging nearly always results in a positive bias. In other words, a simple arithmetic average almost always overestimates the mean relative humidity.
The World Meteorological Organization (WMO)2 and the American Association of State Climatologists (AASC) both recommend that uncertainty (error) in the RH measurement be less than 3%. In the worst case, error due to averaging RH would be additive to the sensor error. As an example, if a sensor specification states that it is within 2.3% over most of the range, any additional error would need to be limited to less than 1% to conservatively meet the WMO and AASC recommendations.
Table 1 shows some statistics for the difference in averaging methods (simple average minus vapor pressure average) including mean, maximum, and minimum, as well as some percentiles. Fifty percent of the data are between the 25 and 75 percentiles, and 95% of the data are between the 2.5 and 97.5 percentiles.
Table 1. Comparison of Difference Between Simple Average and Averaging Vapor Pressures
| Interval | Minimum | 2.5 Percentile | 25 Percentile | Mean | 75 Percentile | 97.5 Percentile | Maximum |
|
Half Hour |
-0.210 |
-0.015 |
0.001 |
0.056 |
0.052 |
0.393 |
5.153 |
|
Hour |
-0.430 |
-0.016 |
0.006 |
0.126 |
0.140 |
0.782 |
5.663 |
|
Three Hour |
-1.026 |
-0.032 |
0.057 |
0.495 |
0.651 |
2.369 |
7.065 |
|
Daily |
-0.937 |
-0.128 |
2.270 |
5.164 |
8.033 |
11.277 |
14.829 |
For both the half-hour and hourly intervals, most of the data are within 1% of each other. Therefore, simple averages may be acceptable for these intervals, depending on the sensor you’re using and the purpose of the data, among other considerations. However, greater intervals show substantial bias and demonstrate that a simple average of RH would not represent the data well. In addition, it’s worth noting that it might be more informative for many data needs to store other metrics such as dewpoint or, simply, vapor pressure.
I hope this helps clarify why it is generally not a good idea to average relative humidity for mathematical and statistical, as well as pragmatic, reasons. If you truly need an average RH, especially over longer time intervals, the better practice is to use the average observed and saturation vapor pressures to calculate RH over each time interval. You’re welcome to modify the downloadable example program as needed. Alternatively, simply store the observed vapor pressure and temperature (easily done in a Campbell Scientific data logger). From these, both the relative humidity and dewpoint can be calculated in post-processing if needed.
If you have any questions about averaging relative humidity (RH), please post them below.
1Lowe, P.R. 1976. An Approximating Polynomial for the Computation of Saturation Vapor Pressure. Journal of Applied Meteorology 16: 100-103.
2World Meteorological Organization. Guide to Meteorological Instruments and Methods of Observation. [WMO-No. 8]. Geneva, Switzerland: s.n., 2014.


About the Author
 Dr. Dirk V. Baker was a Senior Scientist and the Global Science Program Manager at Campbell Scientific. His areas of interest included ecology, agriculture, and meteorology—among others. He has a bachelor's degree in wildlife biology and a doctorate in weed science, both from Colorado State University. Dirk’s graduate and postdoctoral research centered around measuring and modeling wind-driven plant dispersal.
Comments
Clayton | 03/12/2020 at 04:12 PM
Thank you for the very informative article, Dr. Baker. I have a question regarding the note about air containing particulate matter. We are an air monitoring agency primarily focused on the measurement of fugitive dust emmissions in the California desert. Could the vapor pressure averaging technique you advised introduce more error than calculating a simple mean hourly average from RH in a very dusty environment? We only became aware of the issue of averaging RH while upgrading dataloggers and discovering that Short Cut does not support this calculation. Another factor is that our agency has always calculated hourly mean RH in the past so there is a reluctance to change the methodology.
Dirk | 03/13/2020 at 12:34 PM
Hi Clayton, thank you for the comment and I'm glad you found the article informative. I don't think there would be an expectation that dusty air would change how the average RH should be calculated. I certainly understand a reluctance to change a long-standing practice. One approach might be to store both simple average RH and that calculated from average vapor pressure for a time to see how much difference there is in your locations and what impact that difference would have on decision-making. From there, you would have a solid basis upon which to decide to change your practice or not.
I hope that helps, please don't hesitate to reach out if we can be of further assistance.
Please log in or register to comment.